Rural Harvest Seasons Shape Poker Tournament Turnouts Across Agricultural Regions
Bianca Ludwig · Aug 26, 2026
Rural Harvest Seasons Shape Poker Tournament Turnouts Across Agricultural Regions
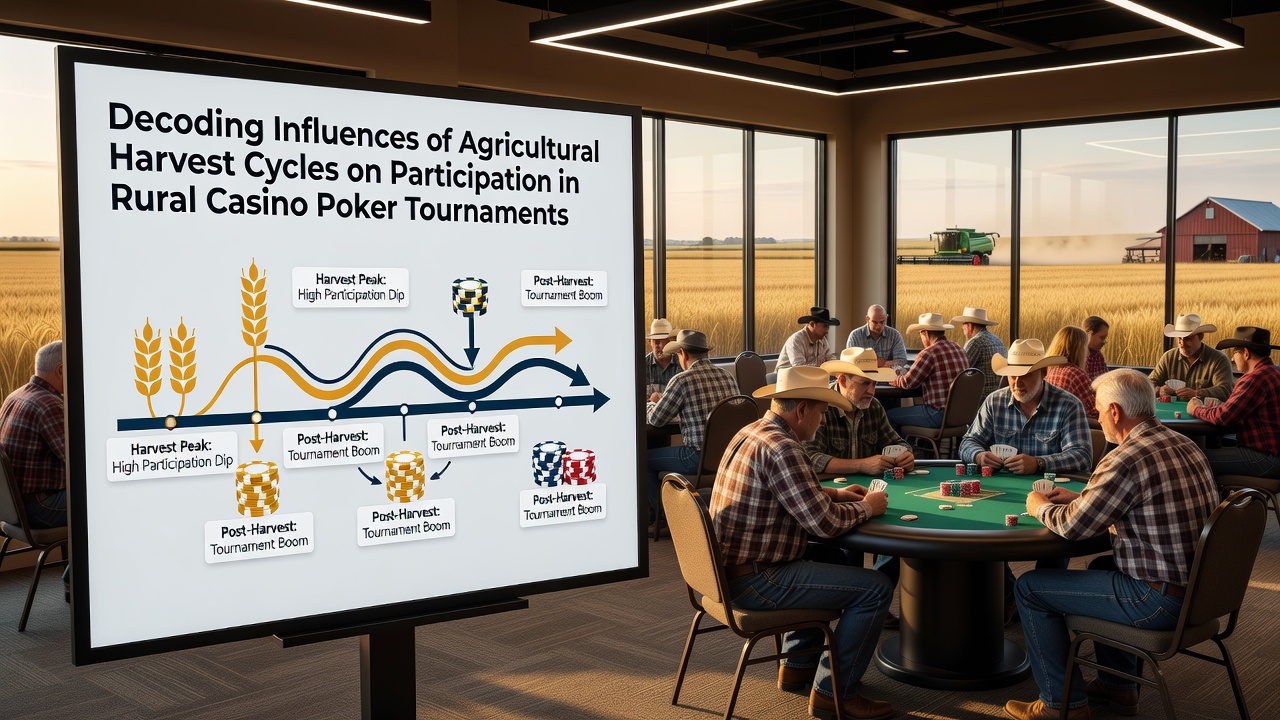
Harvest cycles in farming communities create measurable shifts in local casino poker tournament attendance, according to regional economic reports and venue operator data. Agricultural calendars in grain, produce, and livestock sectors align with predictable changes in disposable income and available leisure time for rural residents. Observers note that these patterns emerge most clearly in Midwest and Great Plains states where large-scale farming dominates local economies.
Seasonal Income Patterns Drive Participation Swings
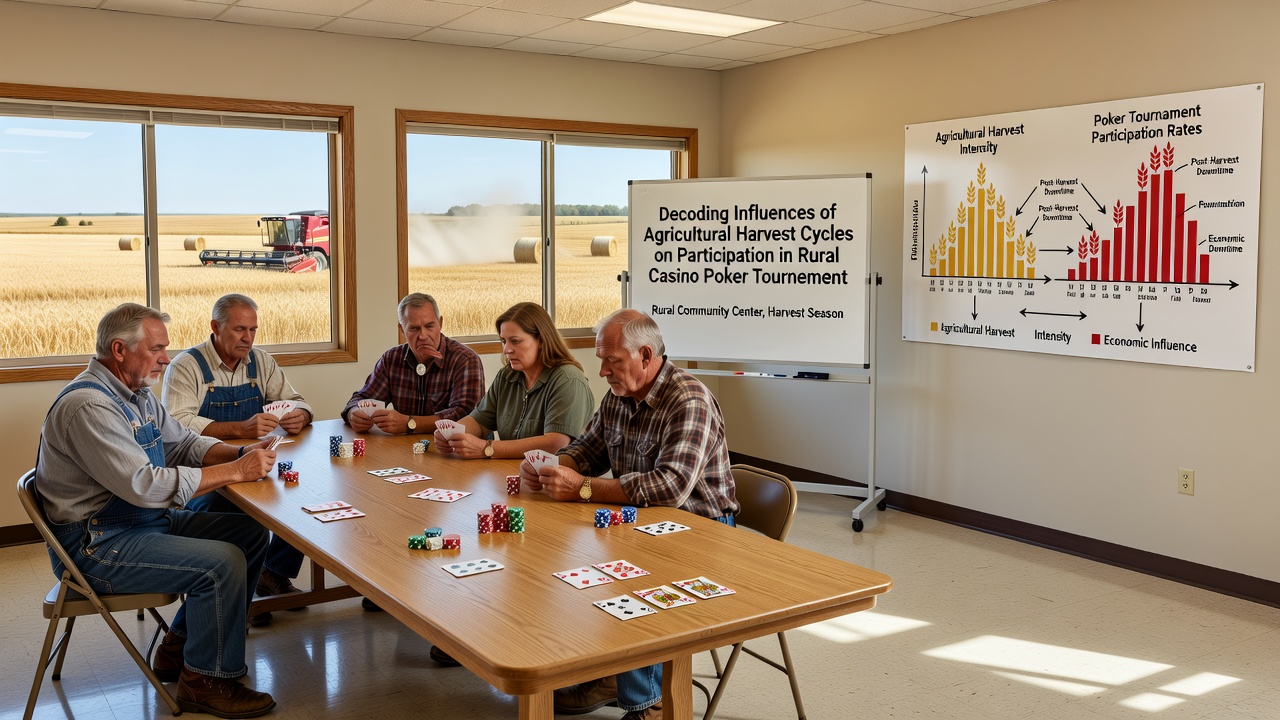
Data from multiple rural casino operators shows enrollment in weekly poker tournaments rises during post-harvest periods when crop sales generate cash flow for farm households. Conversely, pre-harvest months often coincide with lower registration numbers as operators and laborers focus on planting and equipment maintenance. Figures compiled through 2025 and into early 2026 indicate average tournament fields expand by 15 to 22 percent in the two months following major grain harvests in states such as Iowa and Nebraska.
Researchers tracking player demographics have documented how family-run operations time tournament entries around equipment downtime and hired labor reductions. One study of venues near the Mississippi River corridor found that corn and soybean cycles produced the strongest correlation coefficients with weekly sign-up totals, while dairy and poultry operations showed steadier but smaller fluctuations throughout the year.
Regional Examples Highlight Crop-Specific Effects
In the Texas Panhandle, cotton harvest completion in late fall aligns with increased participation at smaller card rooms offering no-limit hold'em series. Venue records from 2024 through August 2026 demonstrate that tournament prize pools grew alongside local commodity prices, with players citing harvest revenue as a factor in entry decisions. Similar patterns appear in California's Central Valley, where almond and grape harvests influence attendance at rural stops along state routes.
Australian wheat belt communities exhibit parallel trends, where data from state gaming regulators shows tournament volume spikes three to six weeks after harvest completion. These observations come from aggregated player tracking across multiple sites rather than single-venue anecdotes.
Weather and Logistics Add Layered Variables
Extreme weather events that delay harvest windows introduce additional variability into tournament calendars. Prolonged wet conditions in 2025 pushed back soybean collections across portions of Illinois and Indiana, resulting in delayed registration surges that extended into December rather than the typical November peak. Casino marketing teams adjusted satellite tournament schedules accordingly to capture the shifted demand.
Transportation constraints during peak harvest periods also affect player mobility. Limited truck availability and higher fuel costs for long-distance hauls reduce the number of out-of-town participants who travel to rural events. Operators report that mid-week tournaments suffer more than weekend ones because weekday harvest work leaves fewer free hours for travel.
Industry Data and External Correlations
According to reports from the U.S. Department of Agriculture, net farm income projections for 2026 incorporate commodity price forecasts that directly influence discretionary spending categories, including entertainment. Gaming associations in multiple states cross-reference these agricultural statistics with monthly tournament logs to refine staffing and promotion calendars.
University extension services in agricultural states have begun incorporating local casino data into broader rural economic studies. These collaborations reveal that poker tournament participation serves as one visible indicator among several leisure activities that expand after harvest revenue arrives. The connections remain strongest in counties where farming accounts for more than 30 percent of total employment.
Future Monitoring and Adjustments
Venue managers continue refining forecasting models that incorporate both long-range weather predictions and commodity futures prices. Early 2026 data suggests that diversified crop portfolios in certain regions dampen the amplitude of participation swings compared with single-crop dominant areas. Ongoing collection of biometric and attendance metrics at live events supplies additional variables for these predictive tools.
Conclusion
Harvest cycle timing produces consistent, documentable effects on rural poker tournament participation across multiple continents and crop types. Economic reports, venue records, and demographic studies converge on the same core relationship between post-harvest cash availability and increased tournament entries. Continued data collection through late 2026 will clarify how evolving farm practices and climate patterns modify these established rhythms.